Brisbane
Station ID: 94578 | -27.2°S, 153.1°E
Last Updated: 2025-11-15 09:11 UTC
brisbane_20251115_1200Z.txt
No afternoon forecast available for today
Afternoon forecasts are generated when atmospheric conditions show significant heating. The most recent forecast is from a previous day.
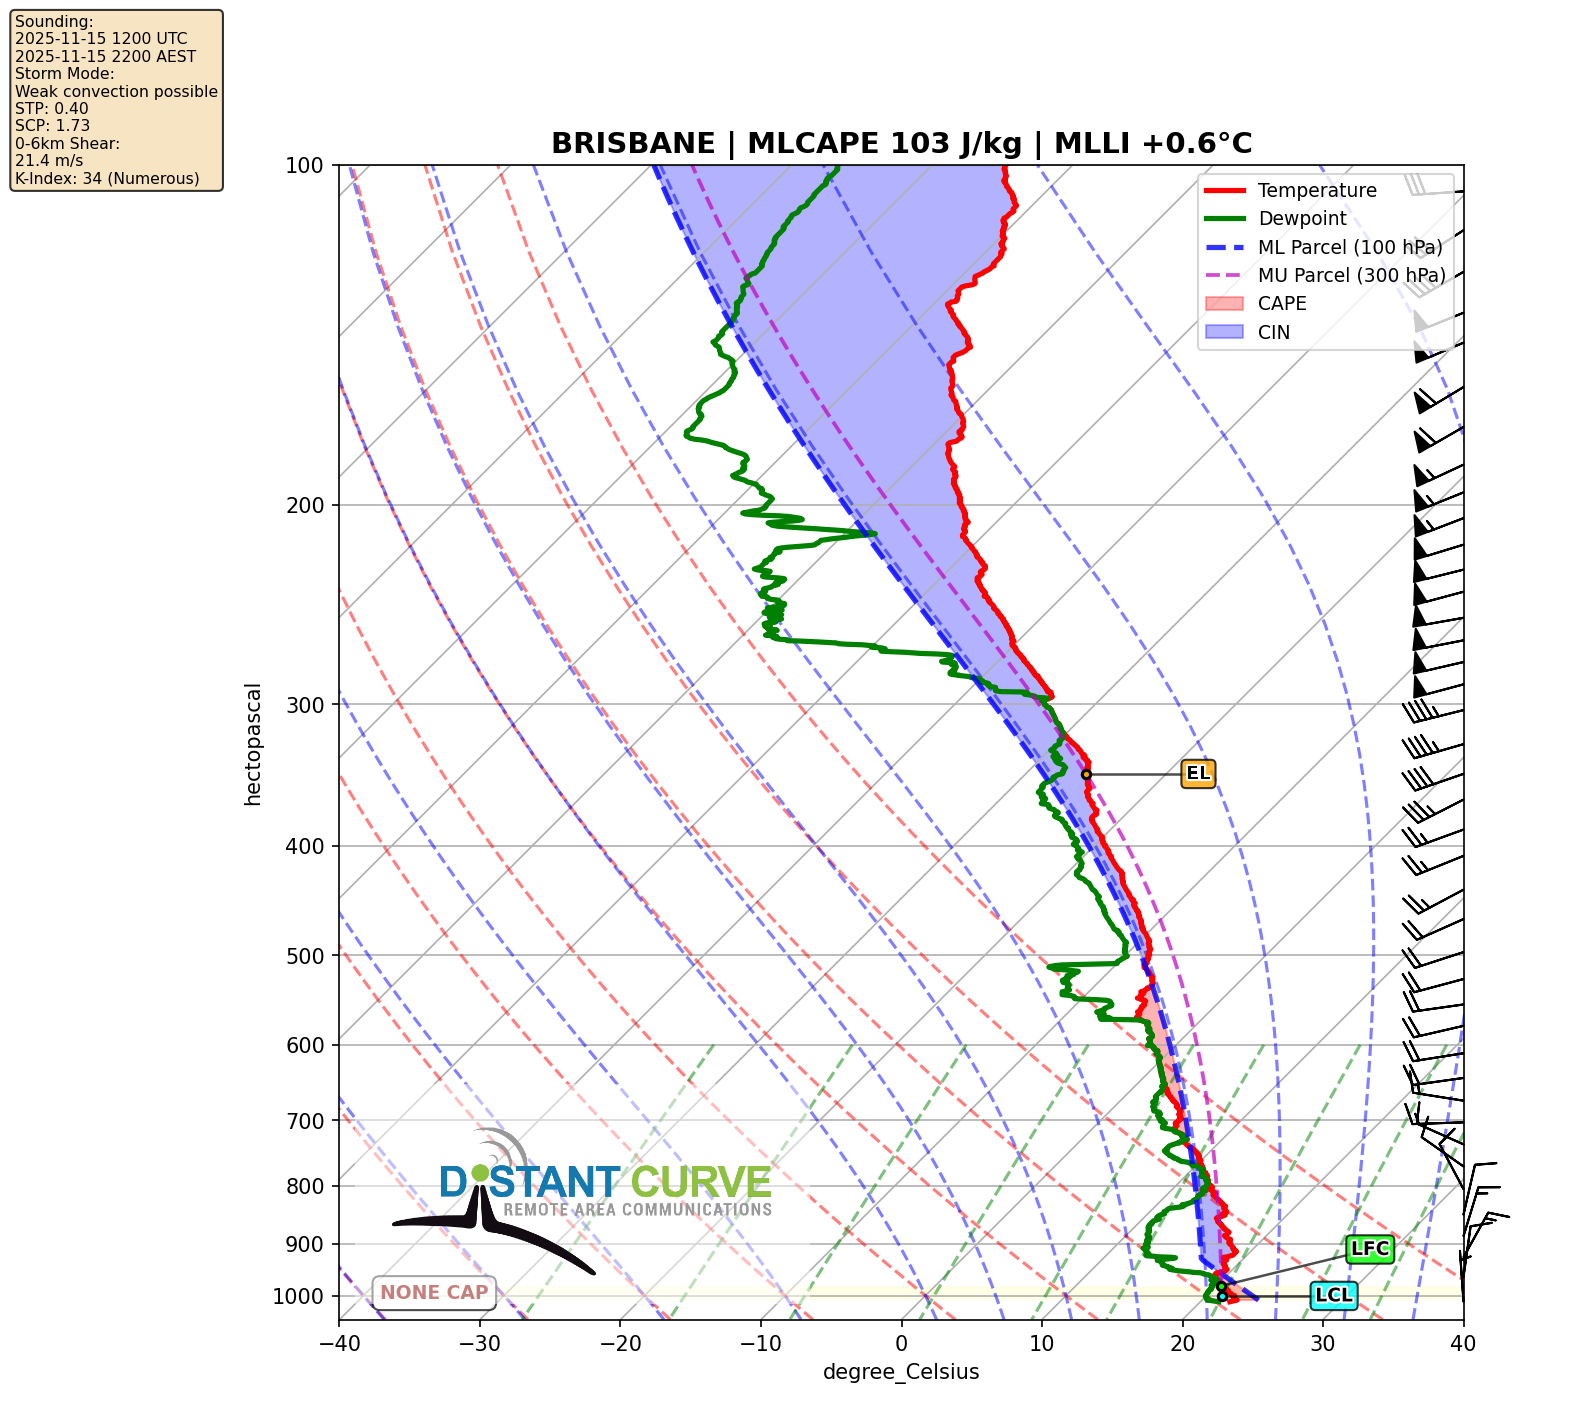
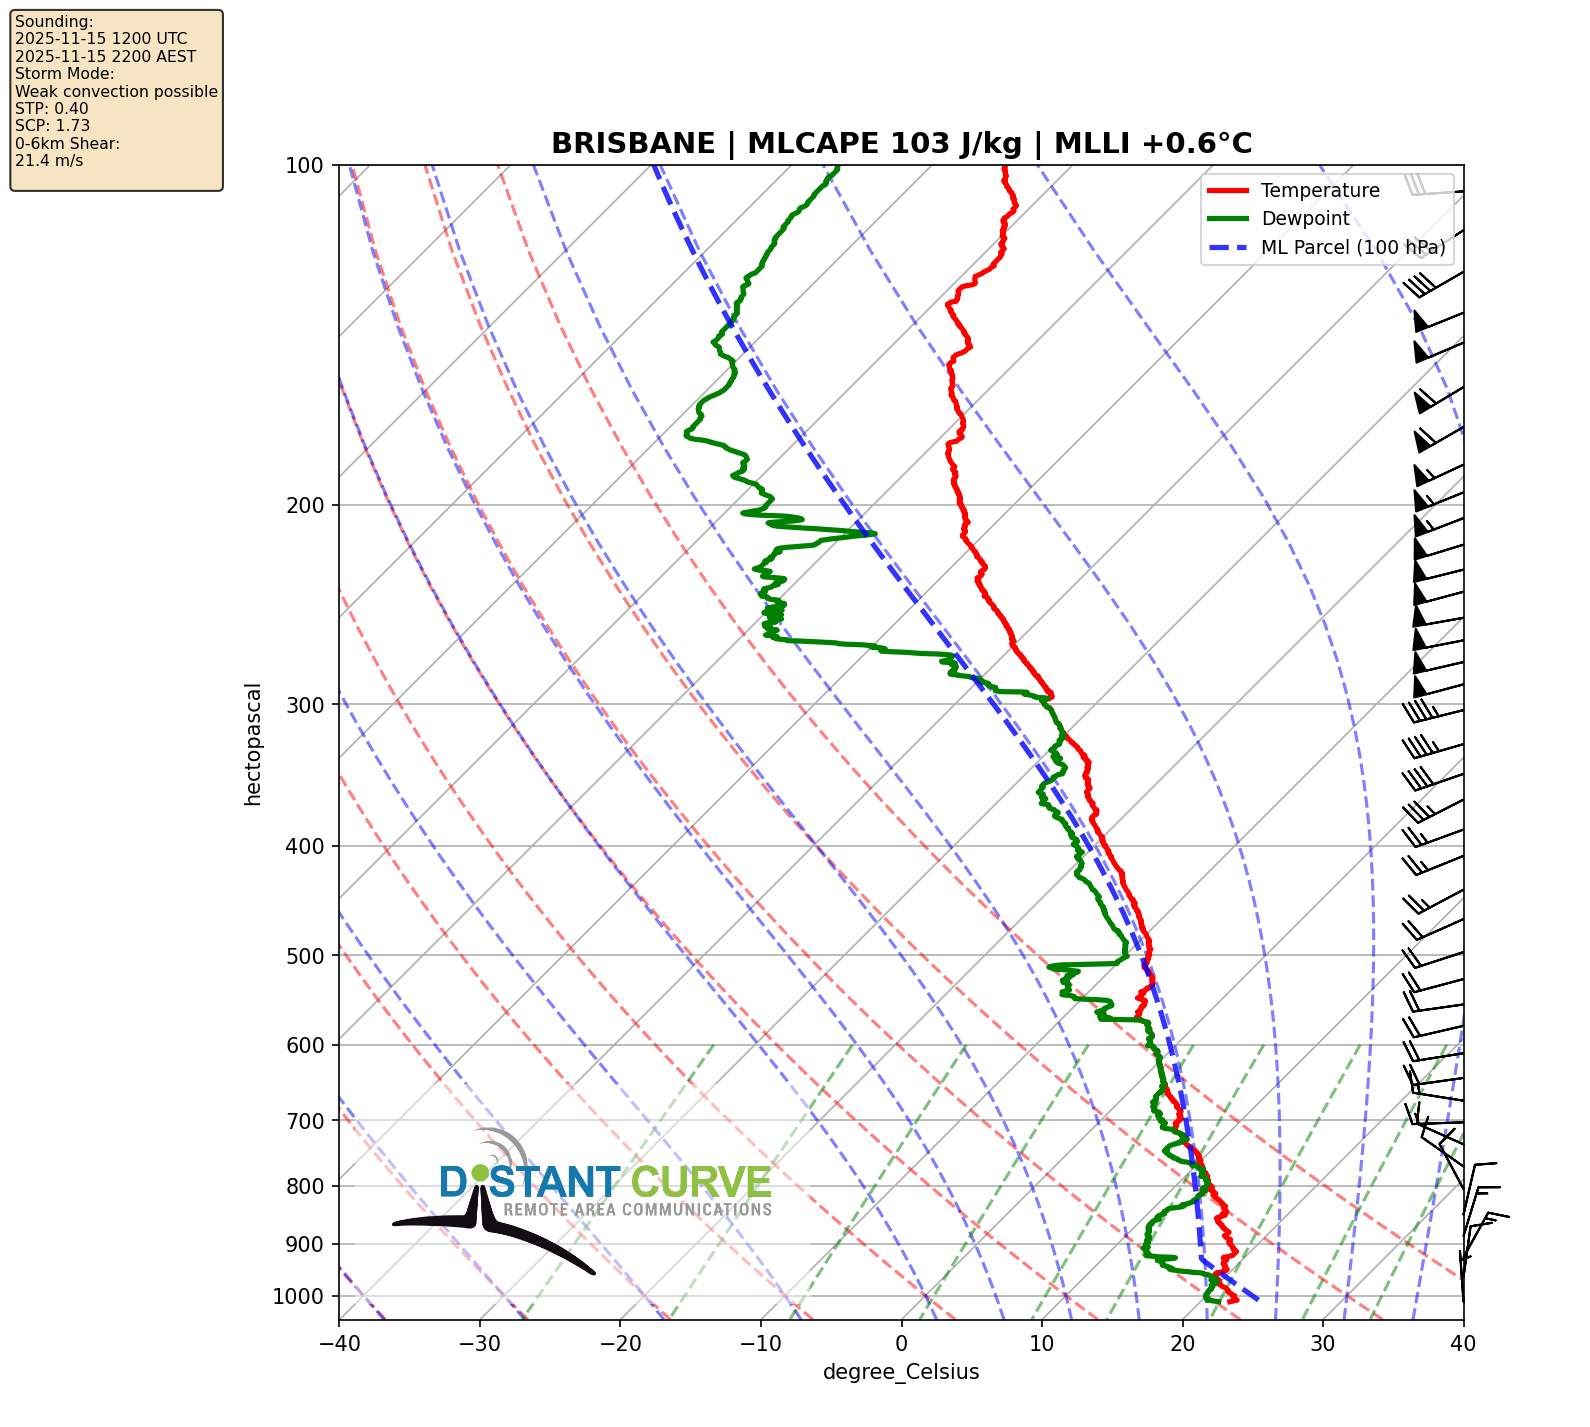
brisbane_20251115_1200Z.png
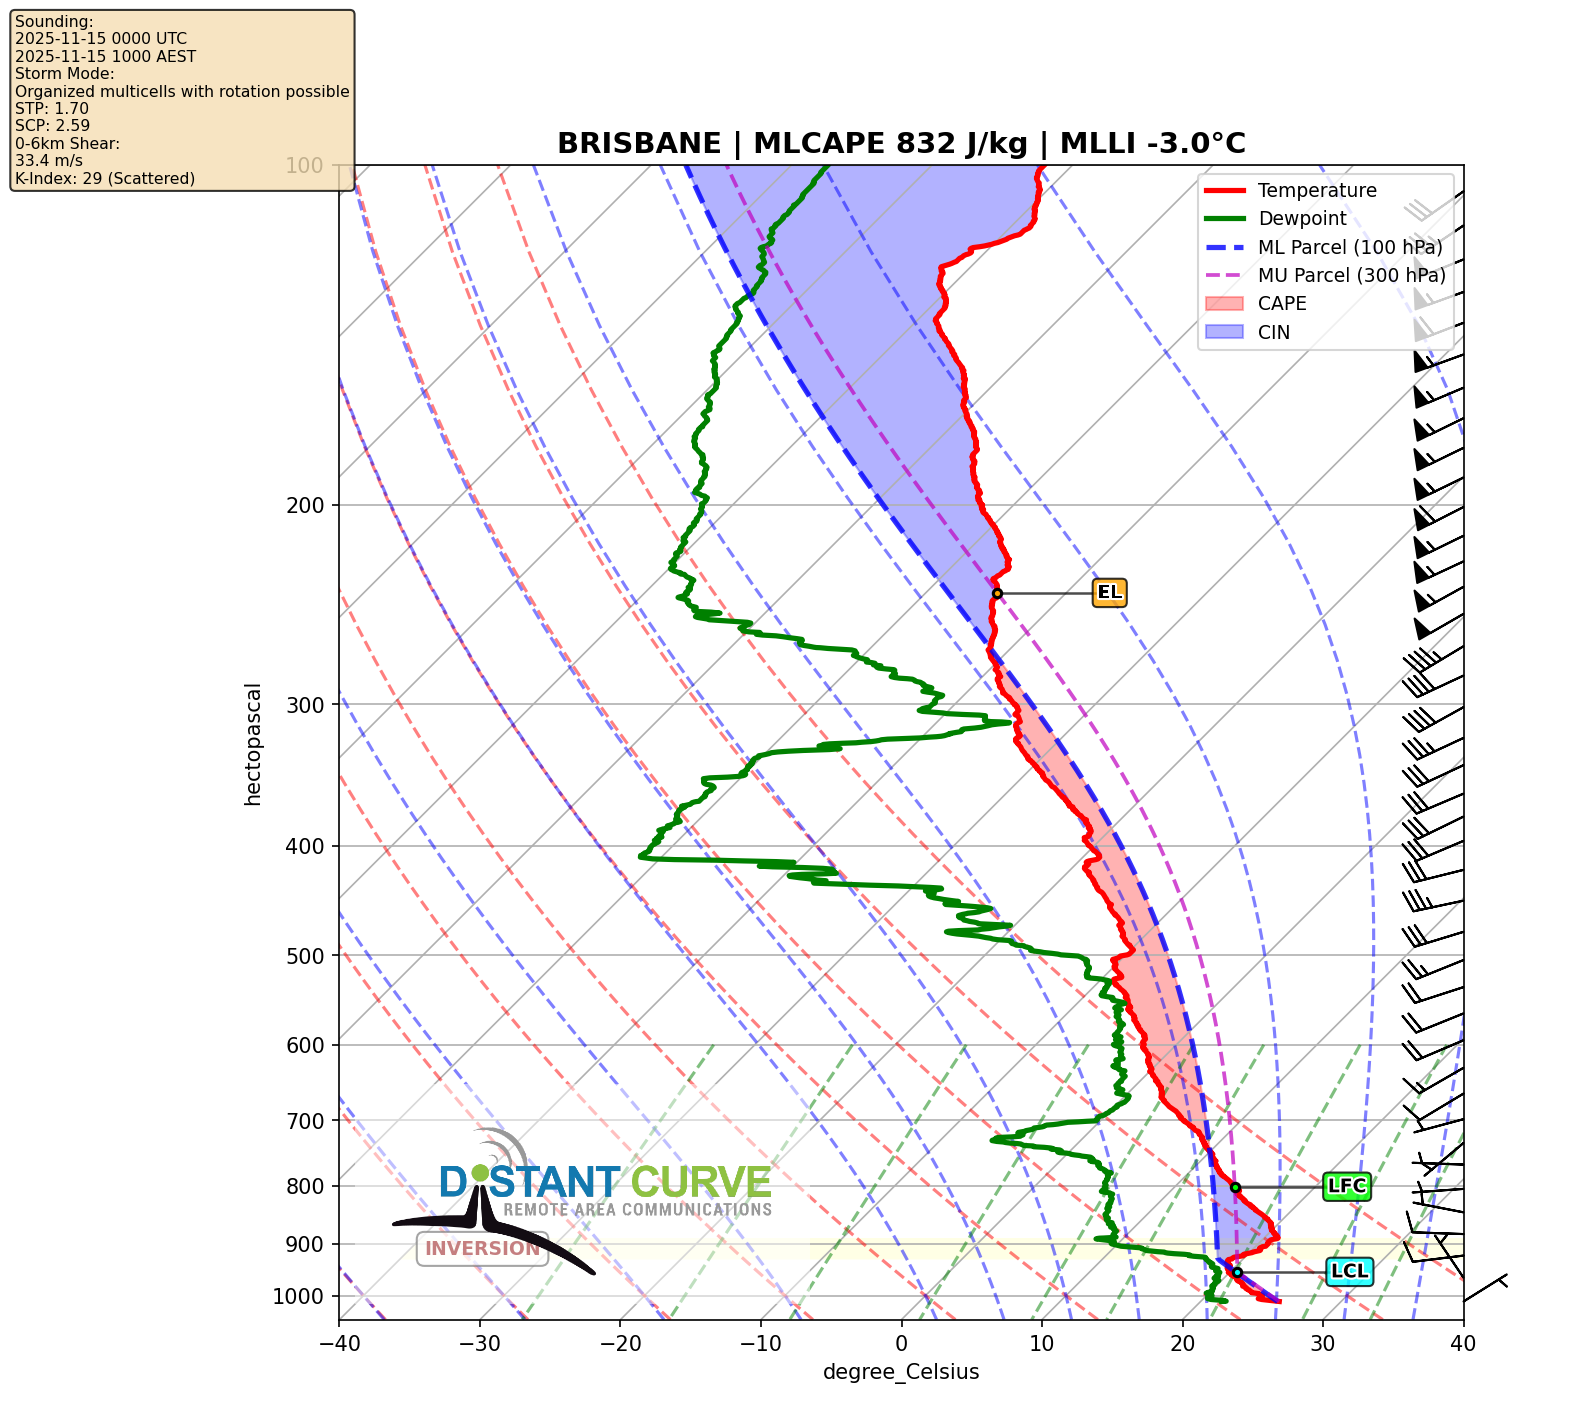
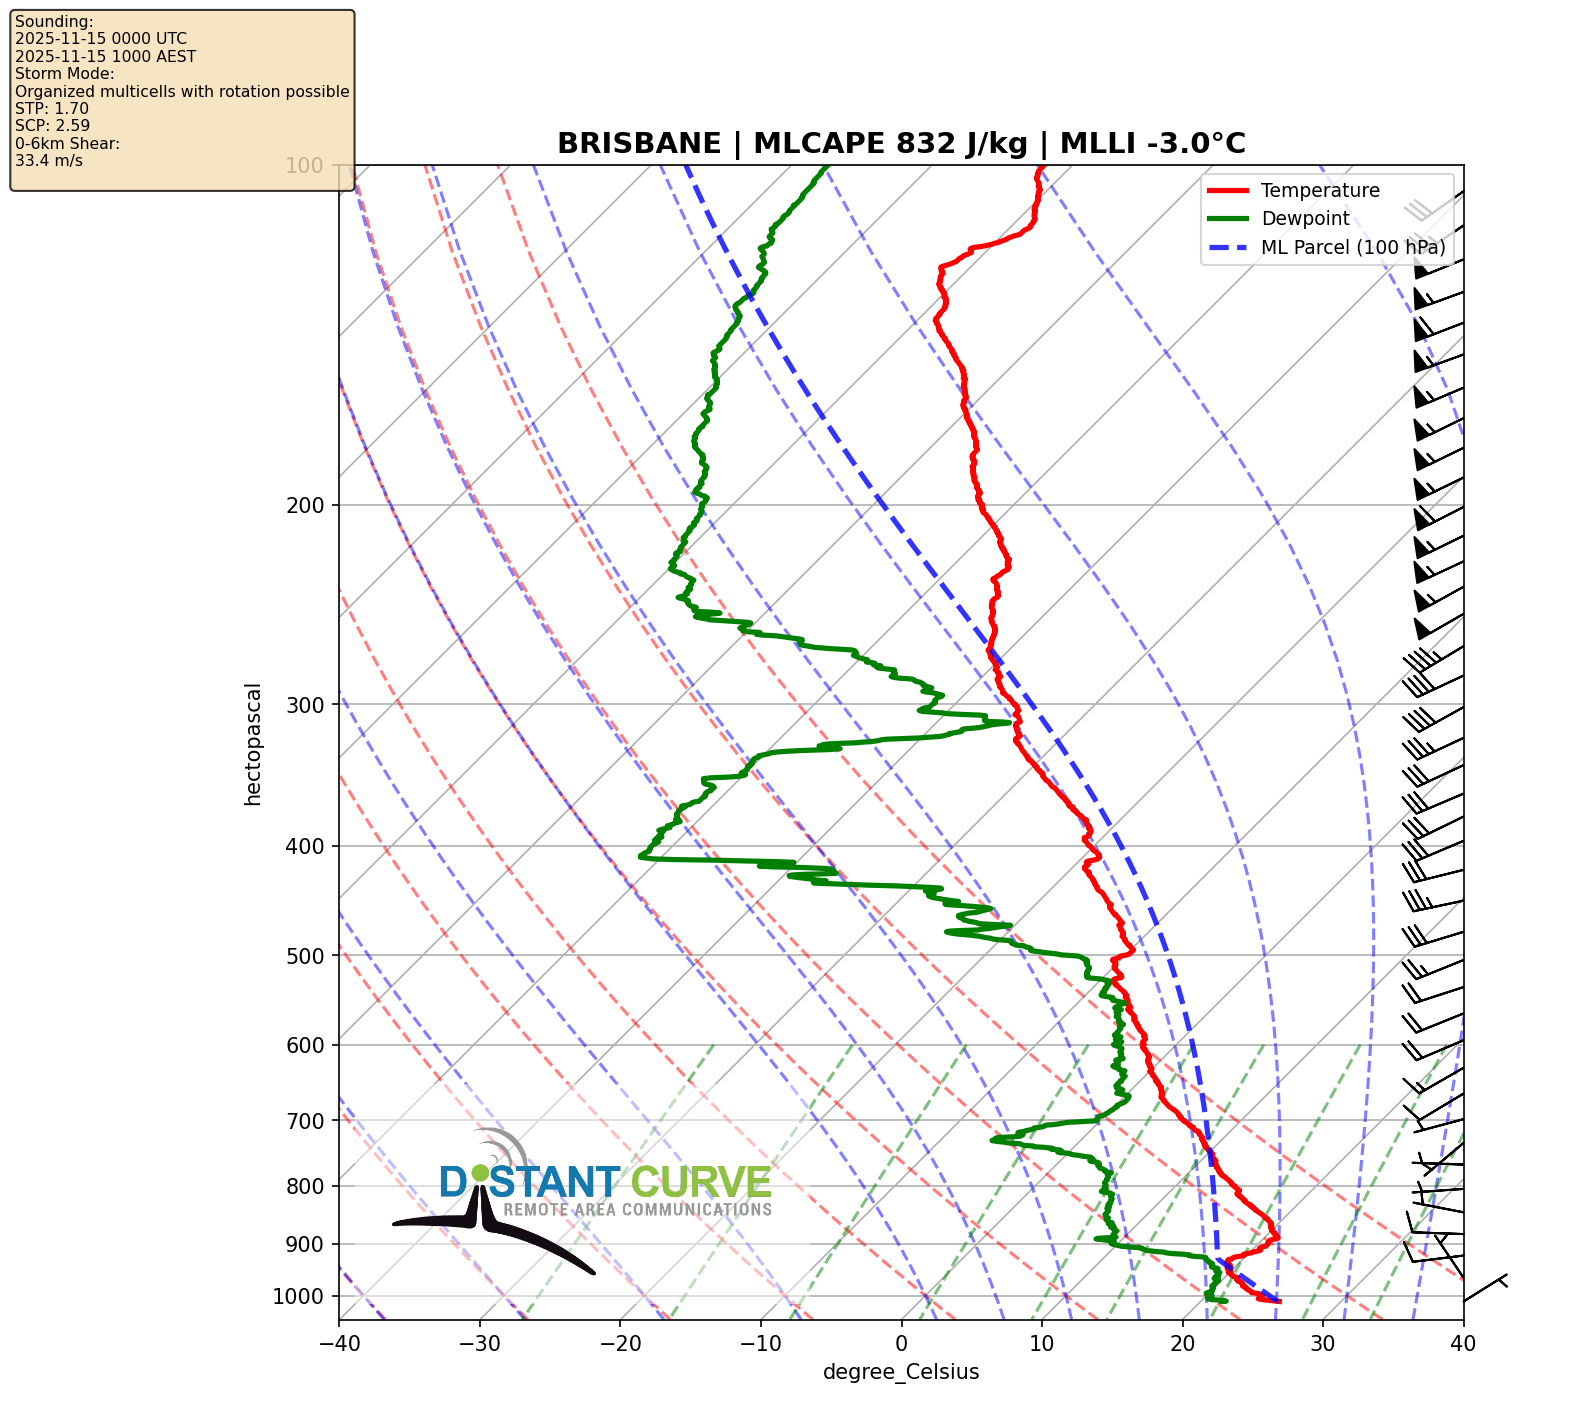
brisbane_20251115_0000Z.png
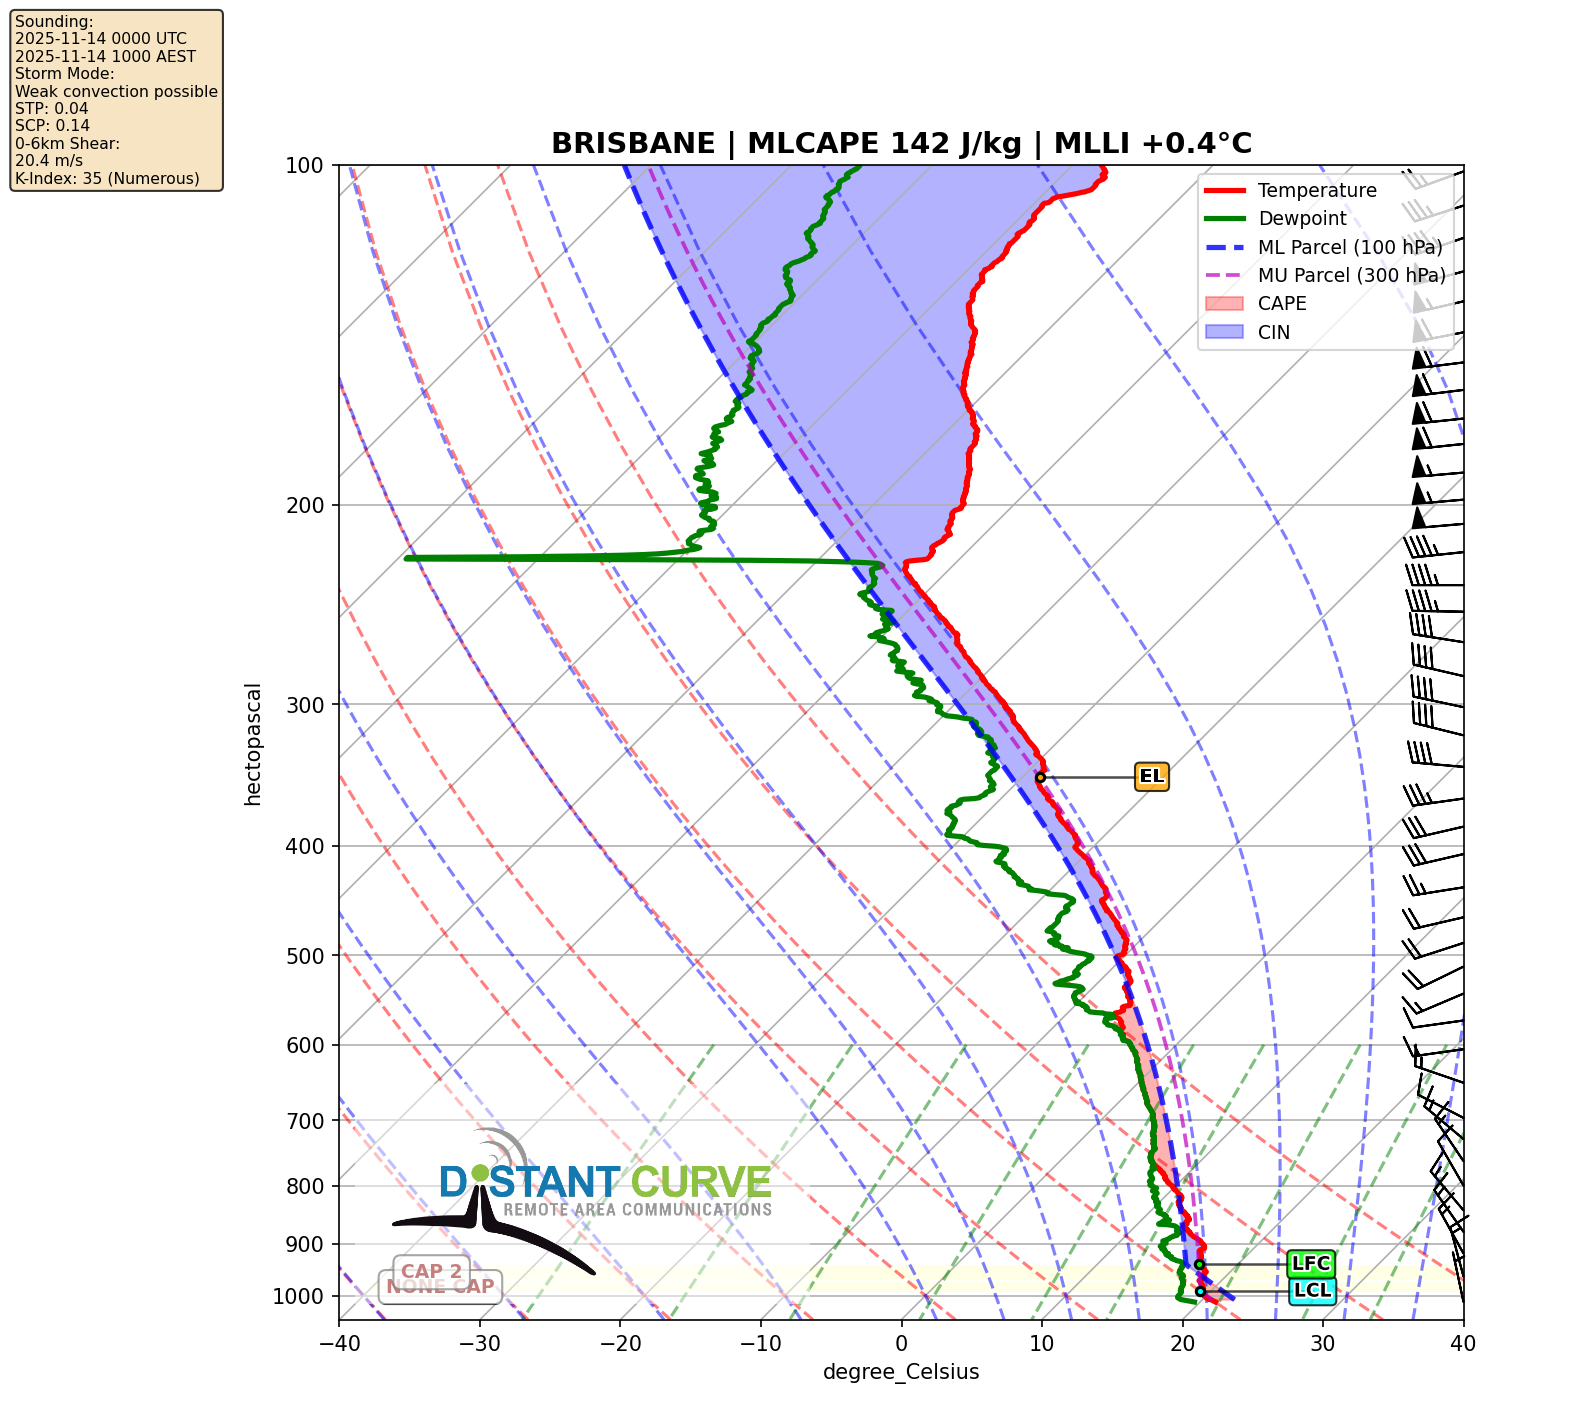
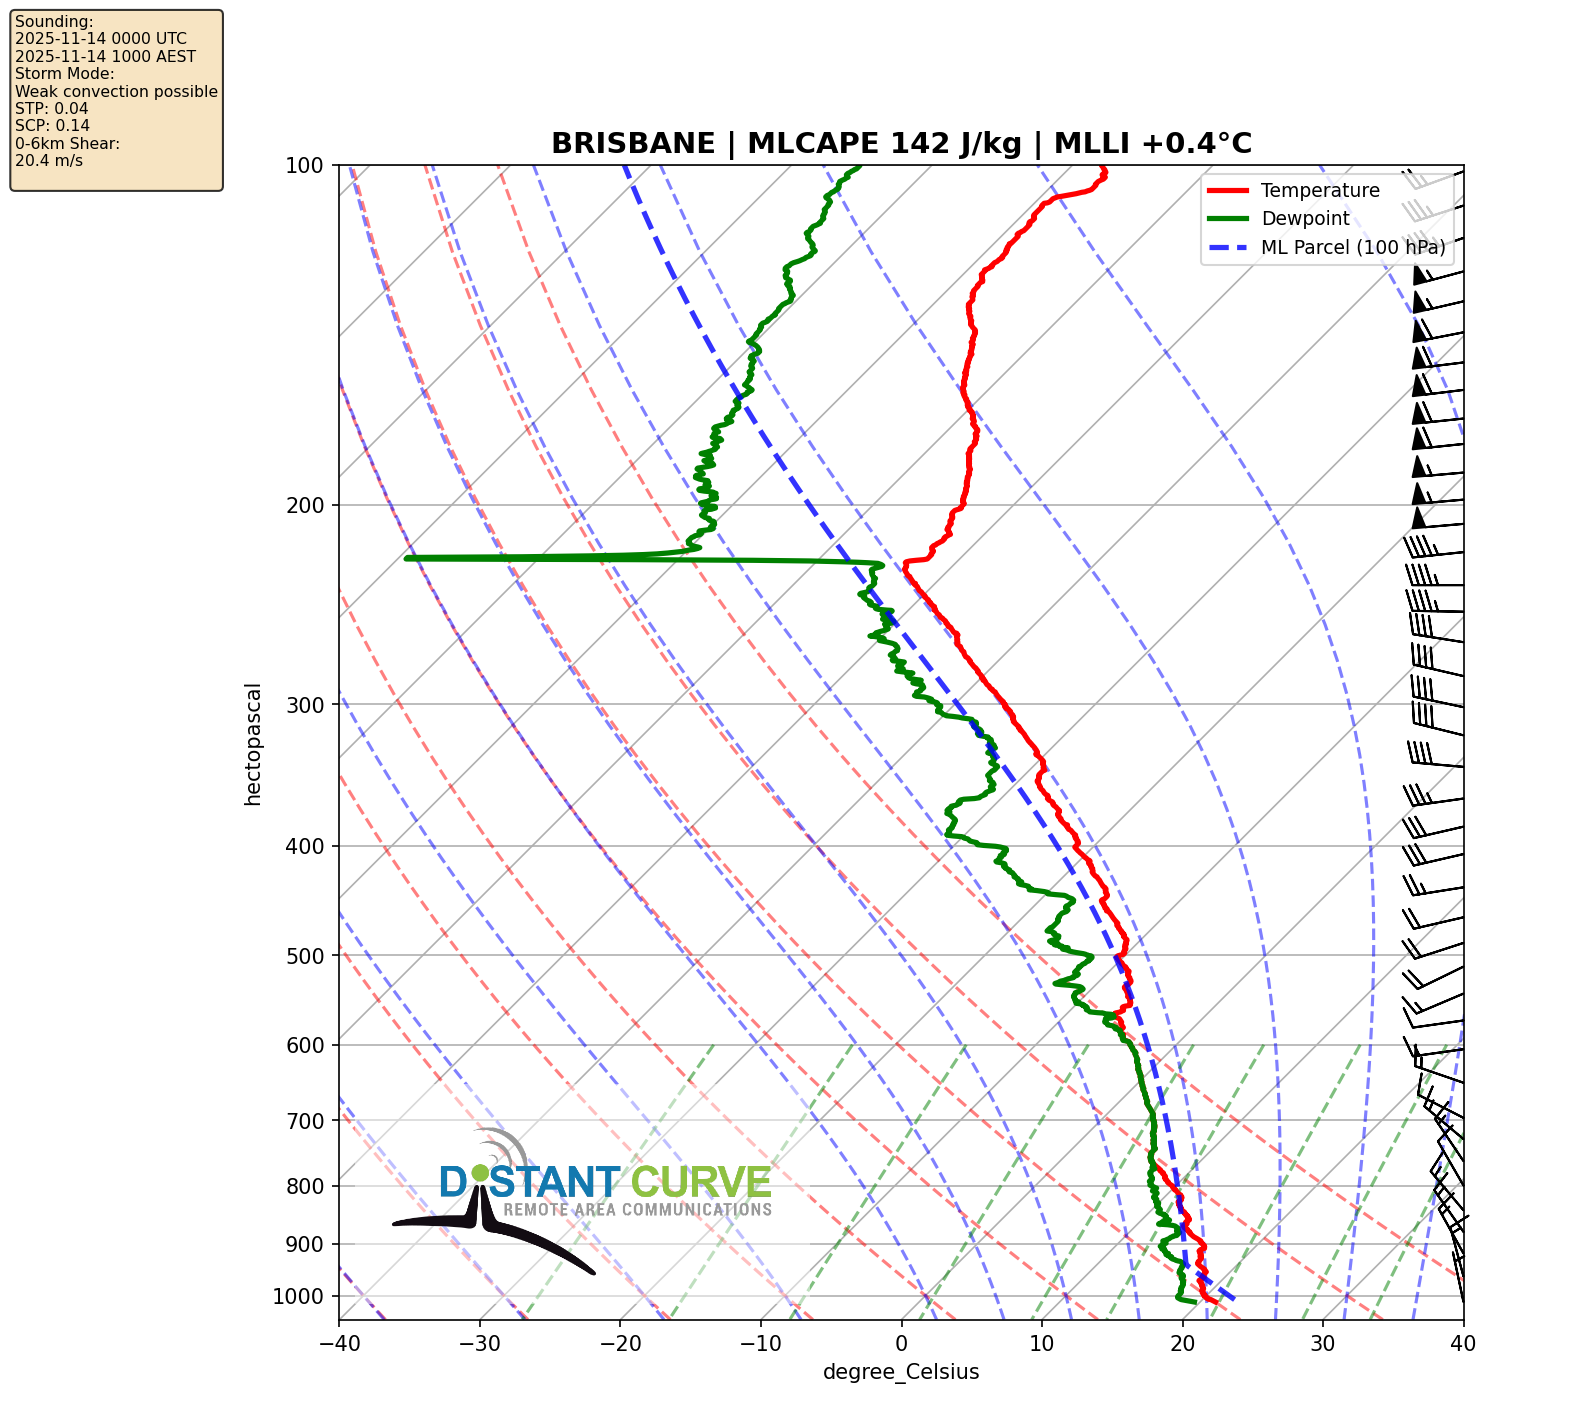
brisbane_20251114_0000Z.png
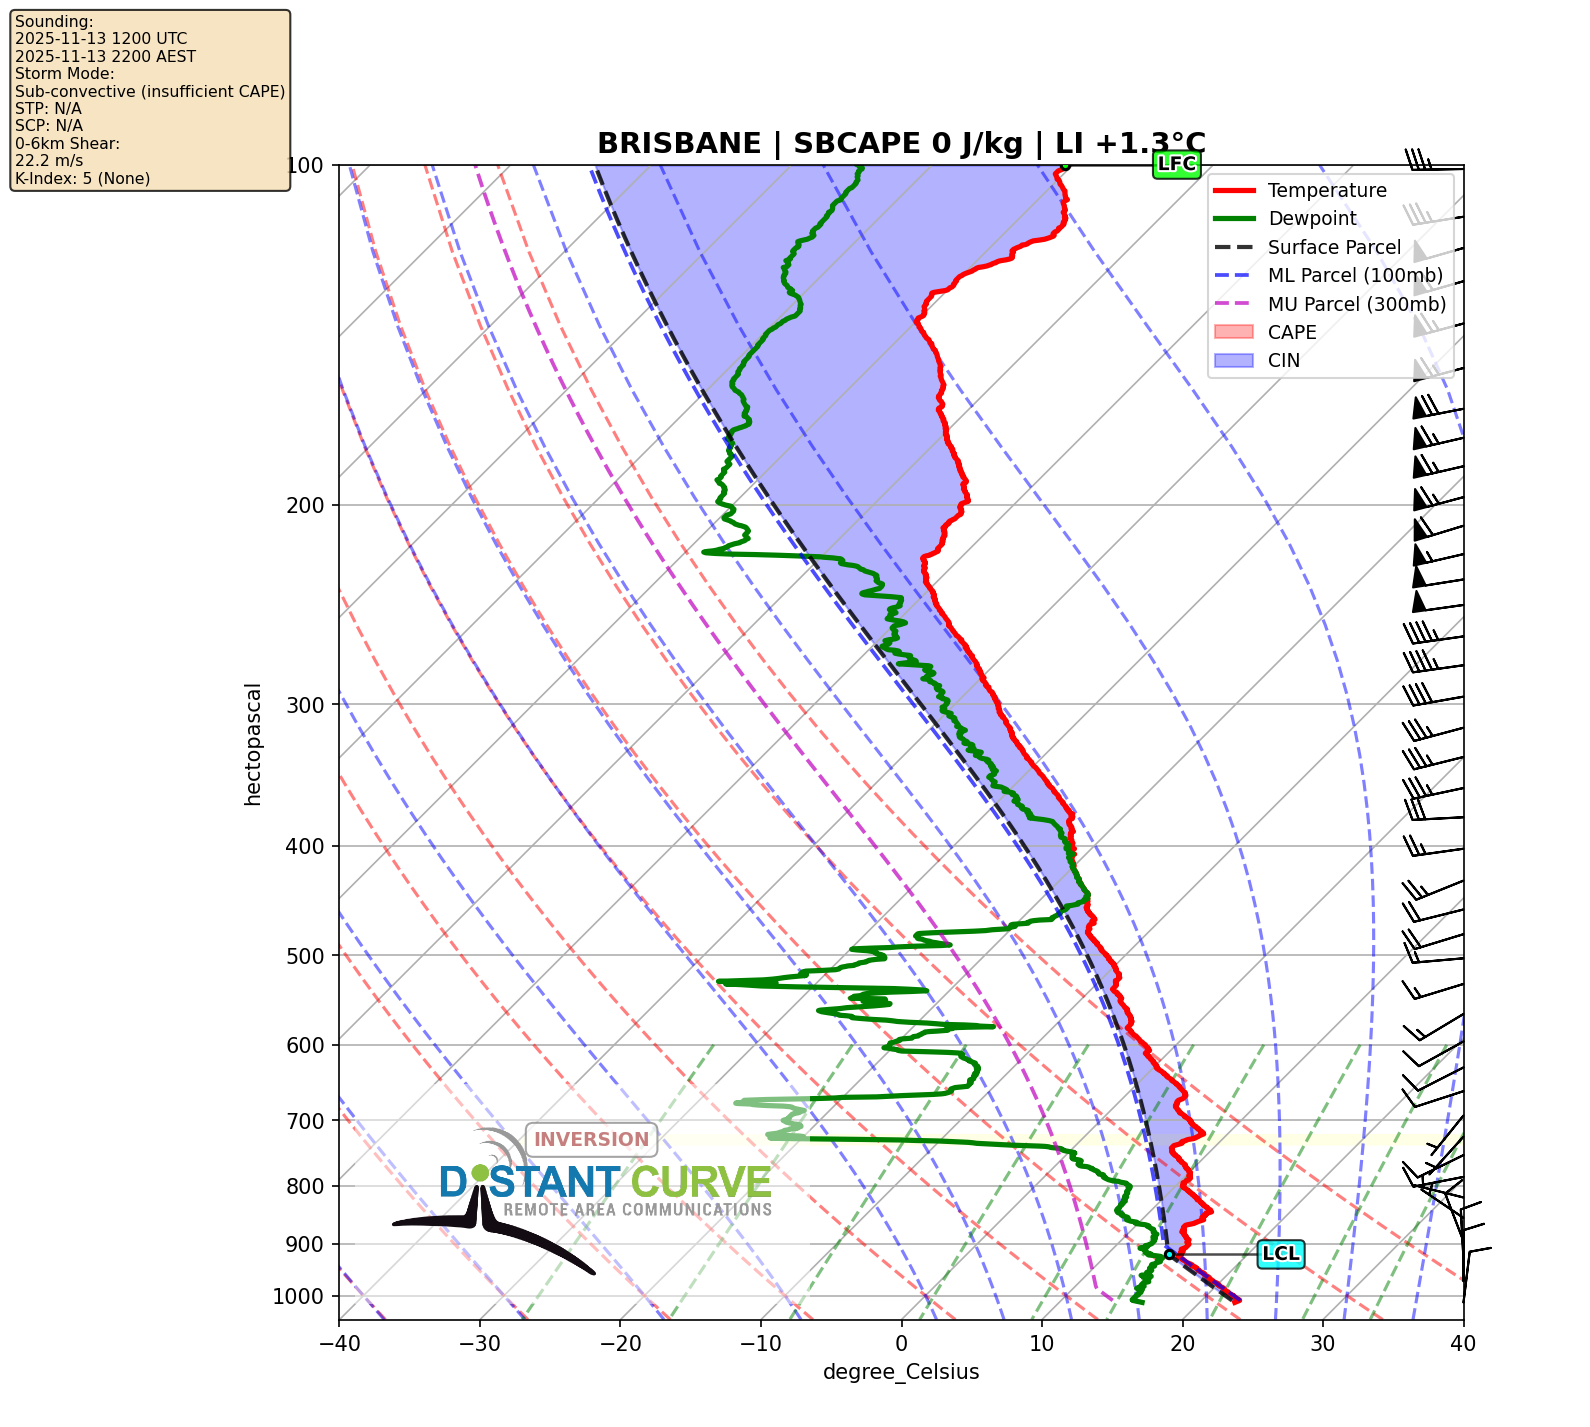
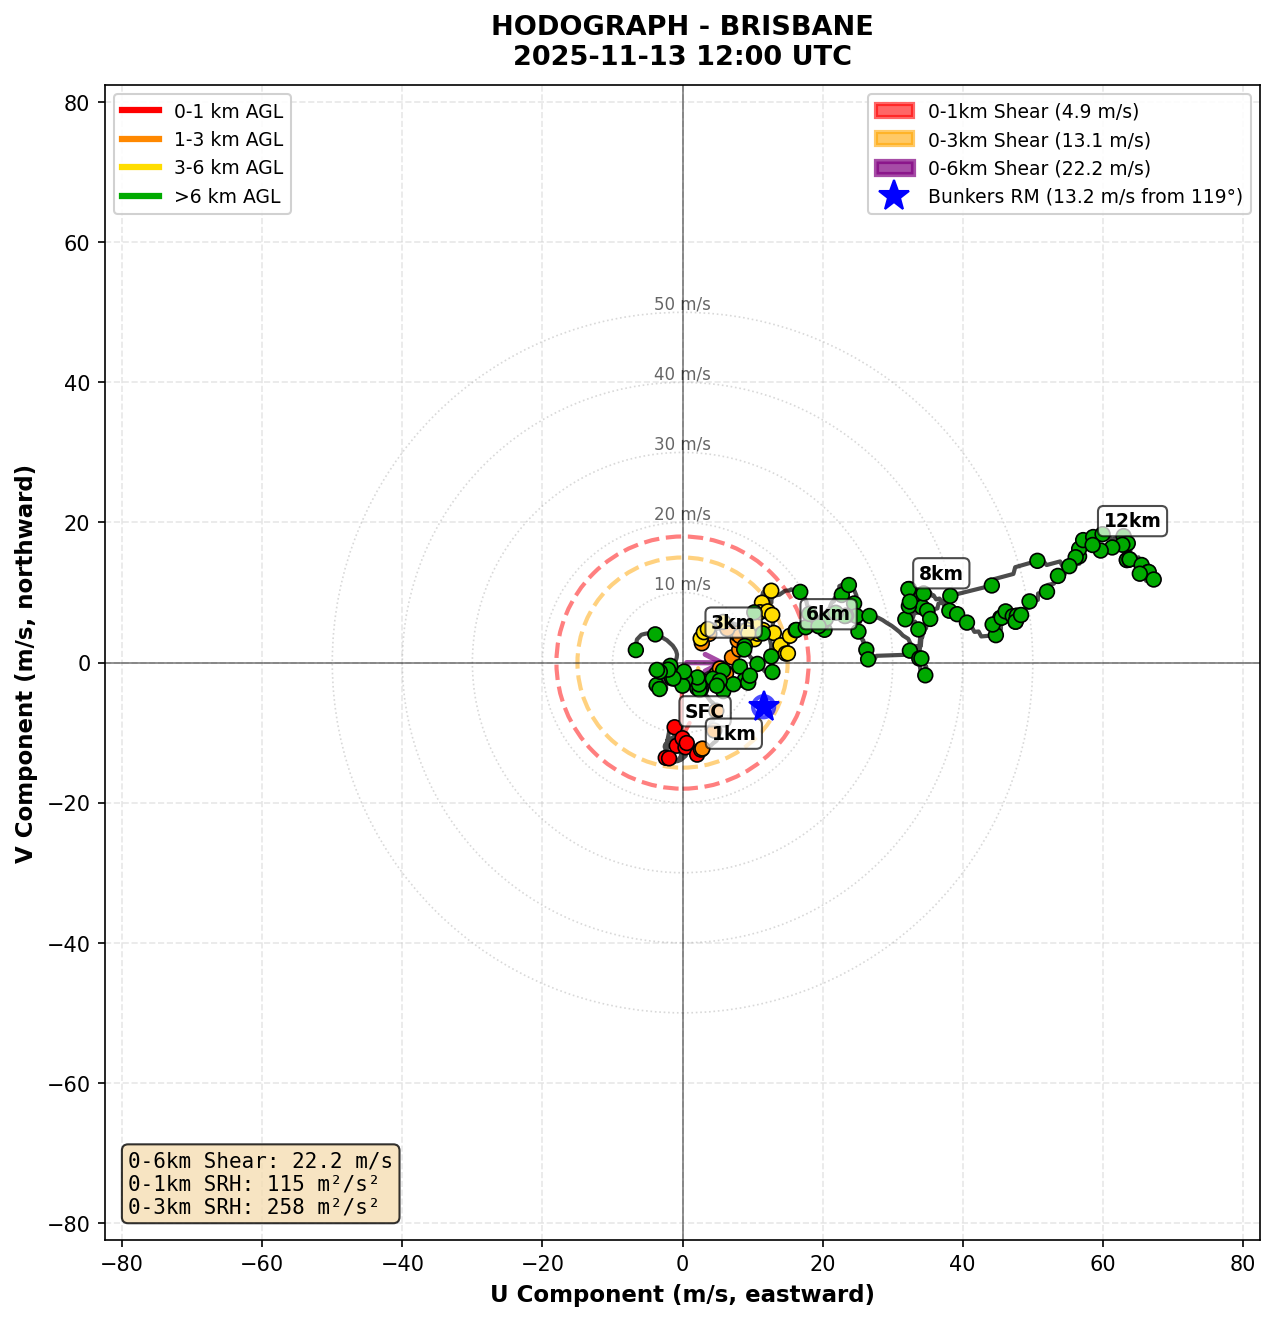
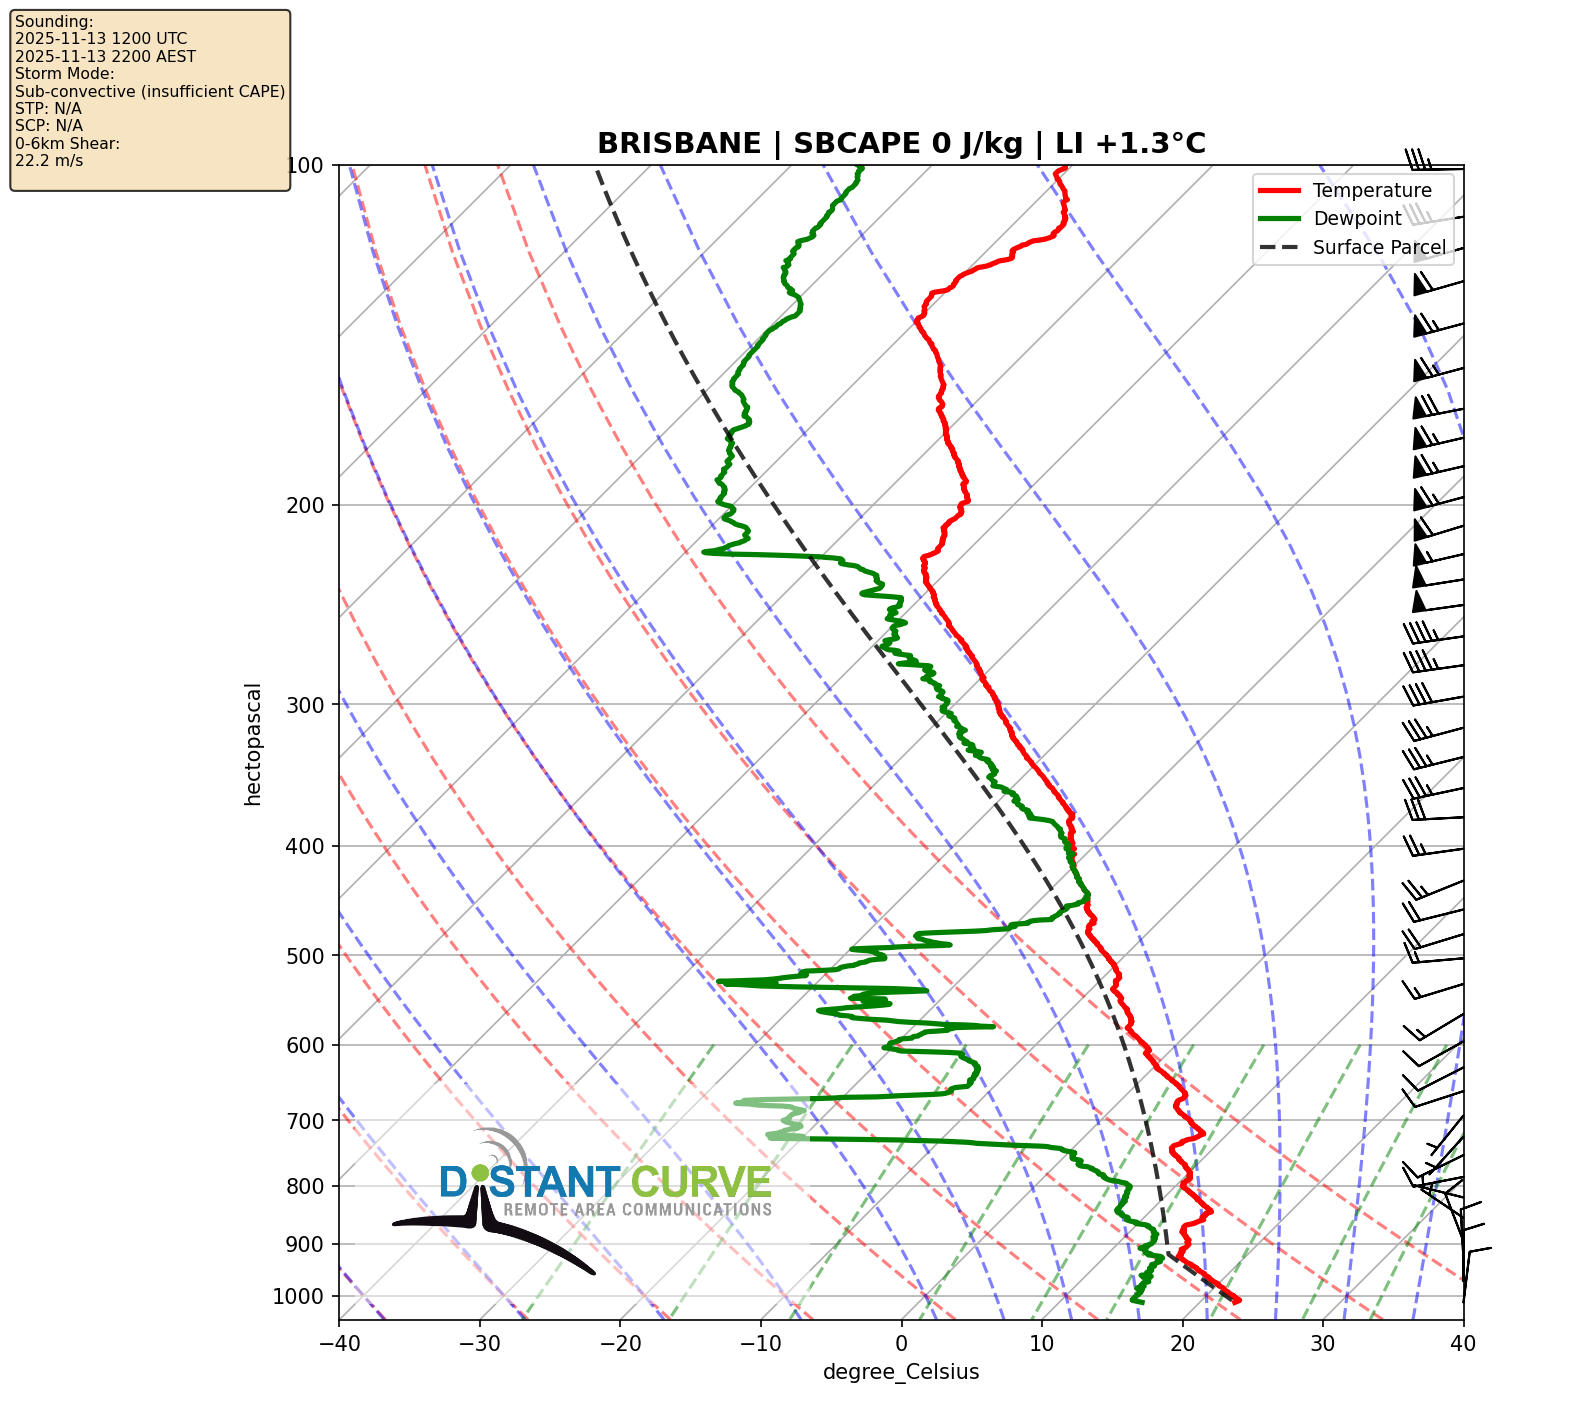
brisbane_20251113_1200Z.png
brisbane_20251115_1200Z.png
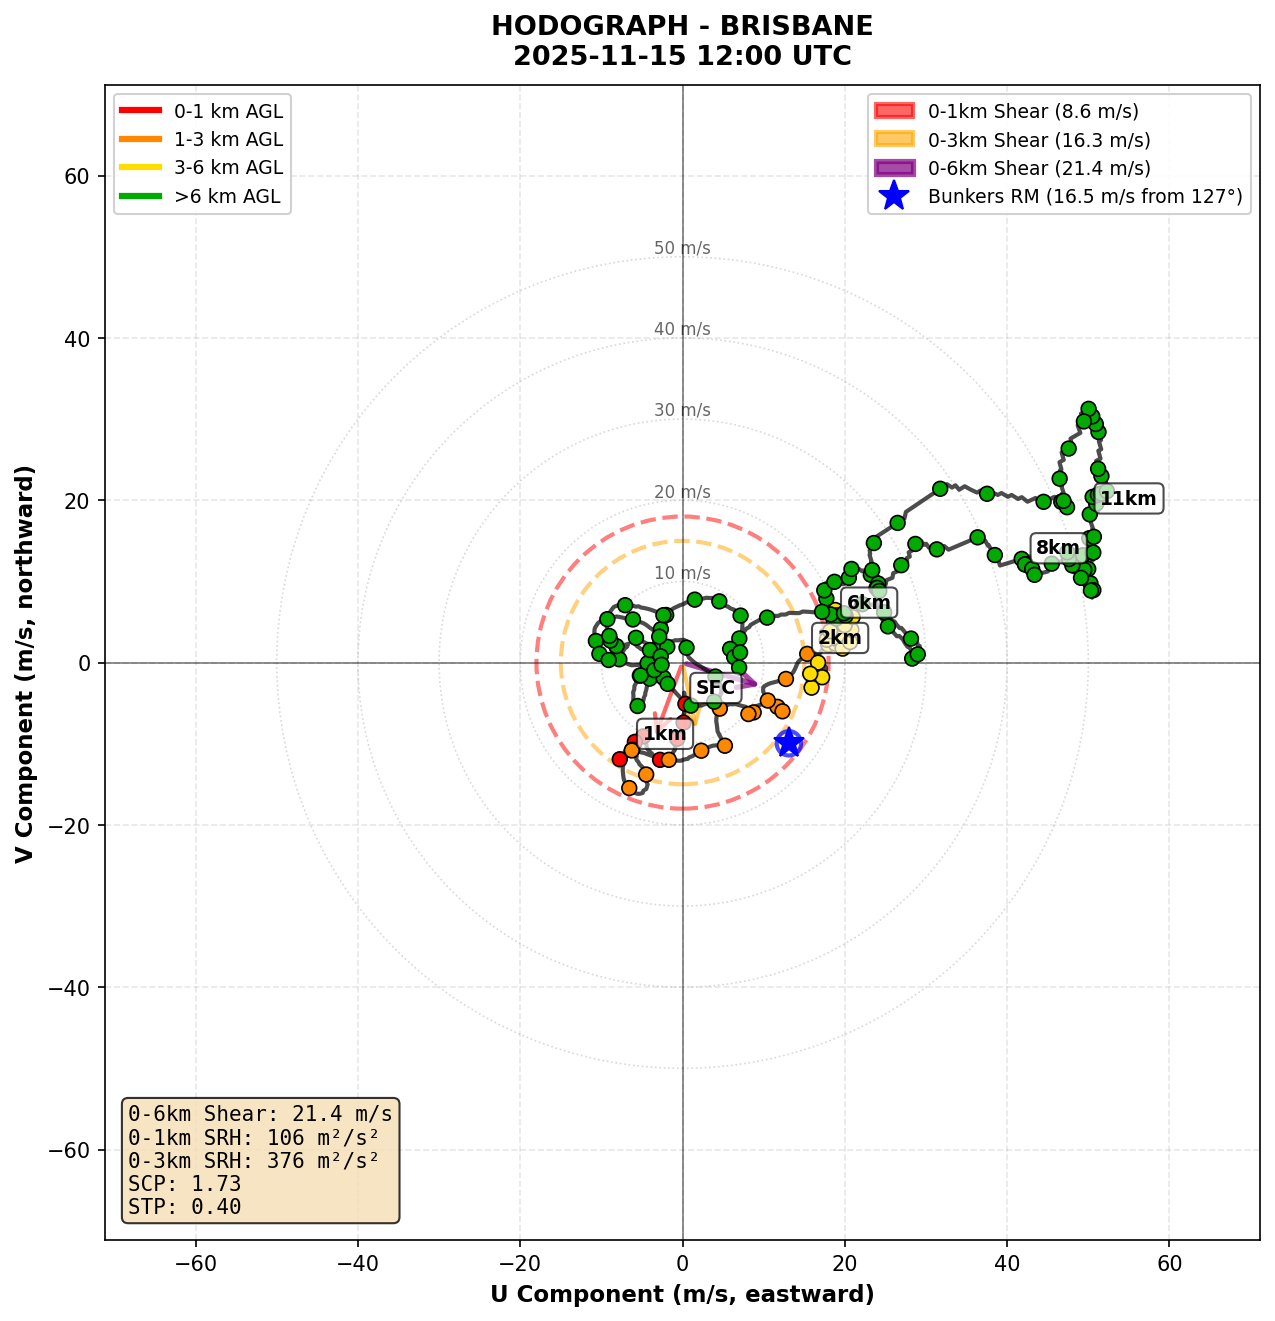
About Hodographs: Hodographs display wind speed and direction changes with height. They are essential for assessing storm organization, supercell potential, and severe weather threats. Curved hodographs with strong low-level veering indicate favorable conditions for rotating storms.
brisbane_20251115_0000Z.png
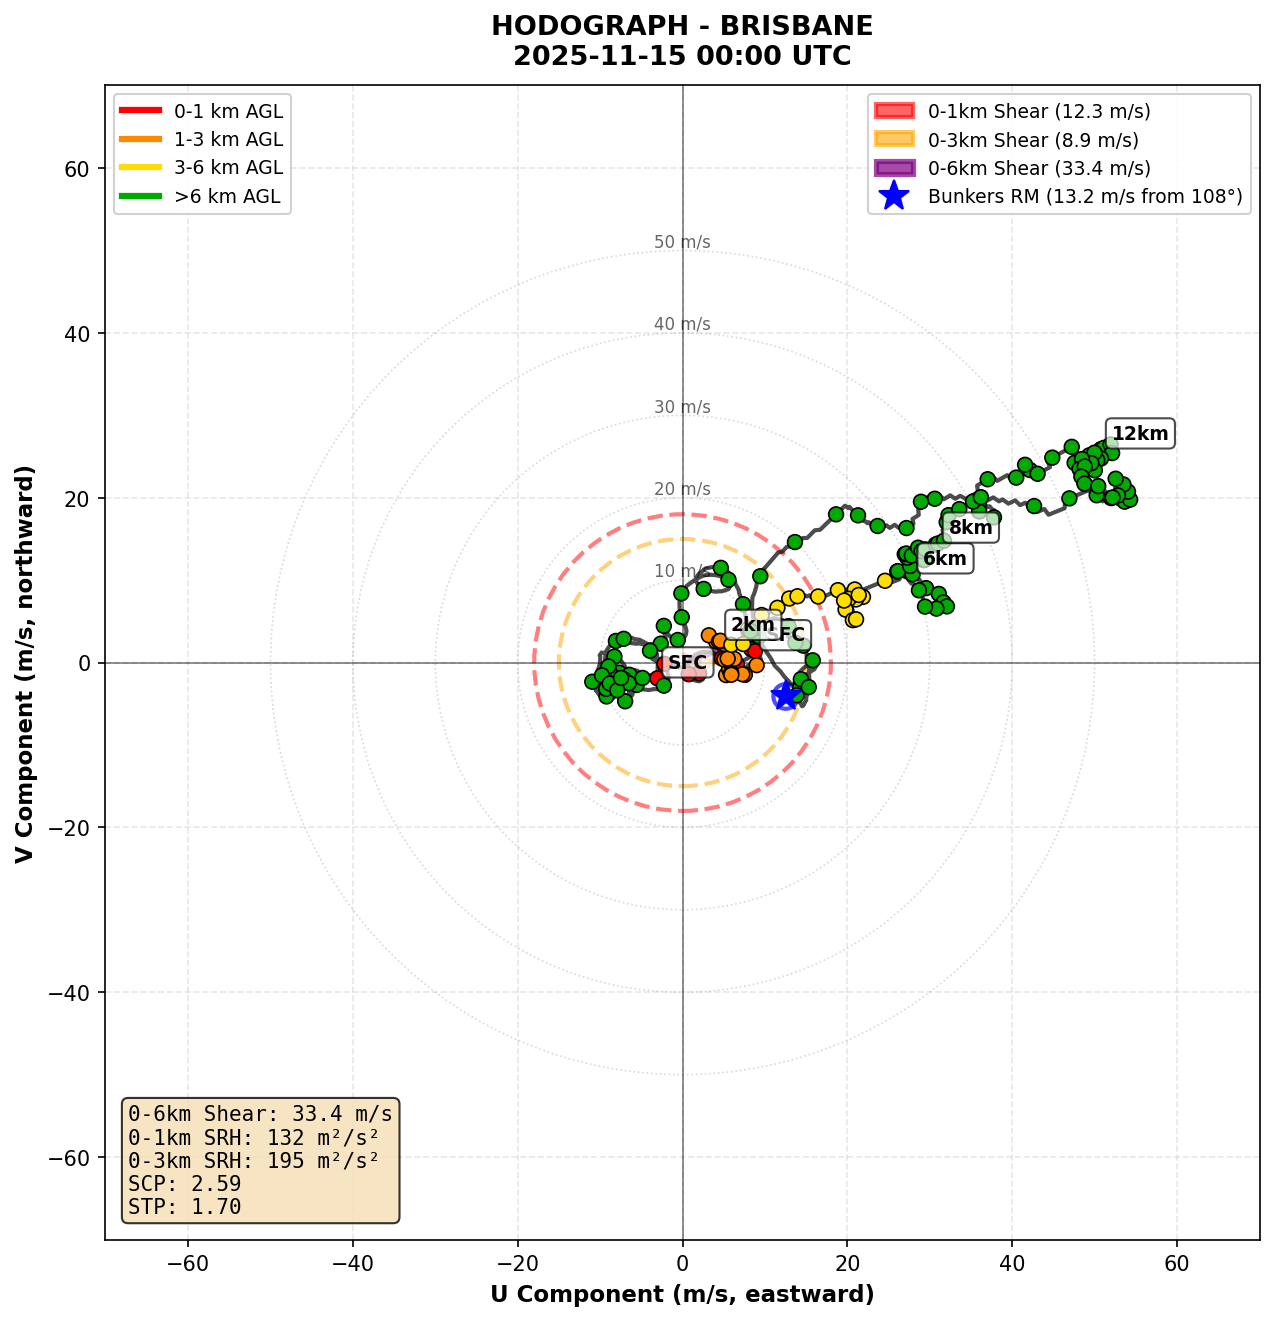
About Hodographs: Hodographs display wind speed and direction changes with height. They are essential for assessing storm organization, supercell potential, and severe weather threats. Curved hodographs with strong low-level veering indicate favorable conditions for rotating storms.
brisbane_20251114_0000Z.png
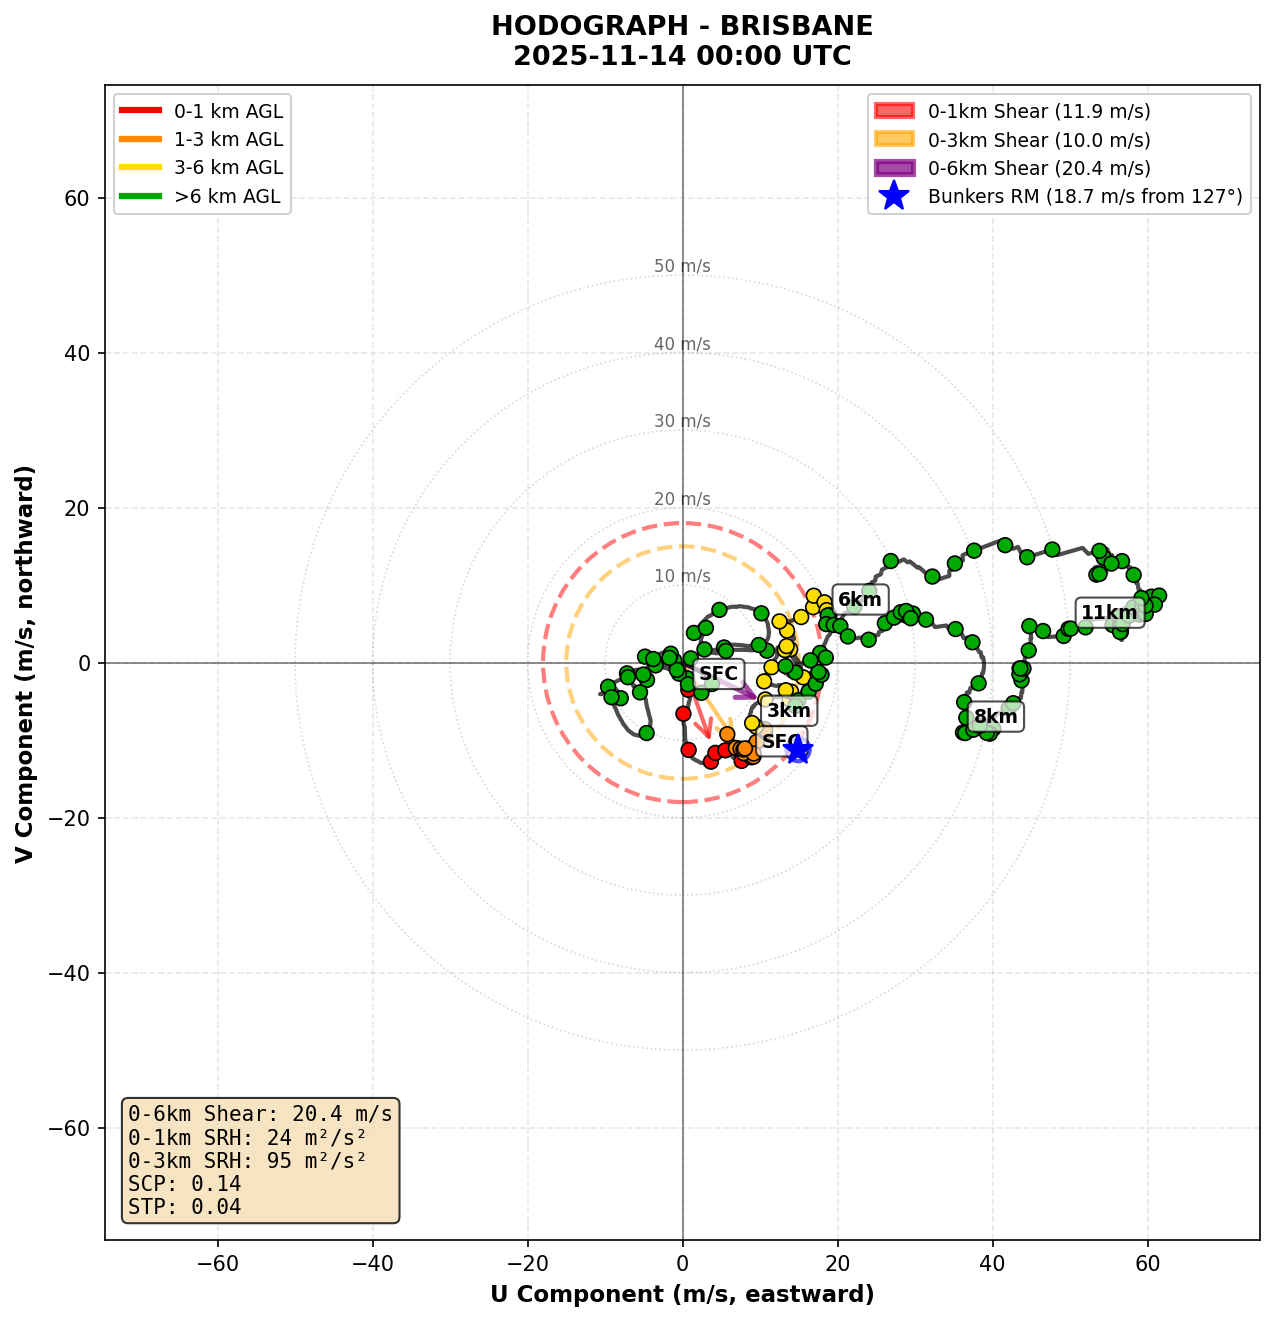
About Hodographs: Hodographs display wind speed and direction changes with height. They are essential for assessing storm organization, supercell potential, and severe weather threats. Curved hodographs with strong low-level veering indicate favorable conditions for rotating storms.
brisbane_20251113_1200Z.png
About Hodographs: Hodographs display wind speed and direction changes with height. They are essential for assessing storm organization, supercell potential, and severe weather threats. Curved hodographs with strong low-level veering indicate favorable conditions for rotating storms.
brisbane_20251115_1200Z.png
brisbane_20251115_0000Z.png
brisbane_20251114_0000Z.png
brisbane_20251113_1200Z.png
No heated plot available for today
Heated plots are generated when conditions warrant analysis. The most recent heated plot is from a previous day.
brisbane_20251115_1200Z.png
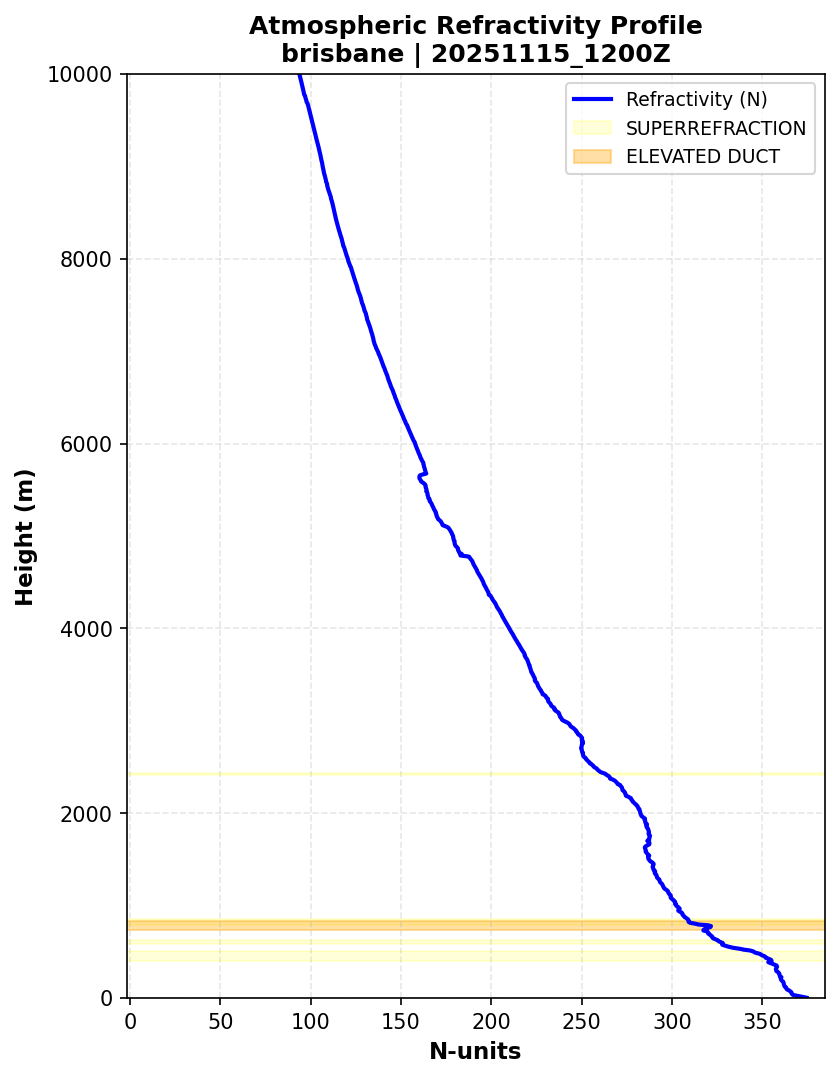
About N-Profiles: These plots show atmospheric refractivity (N-units) vs height. Ducting layers (red/orange) indicate exceptional VHF/UHF radio propagation conditions for HAM operators. Superrefraction zones (yellow) show enhanced but normal propagation.
brisbane_20251115_0000Z.png
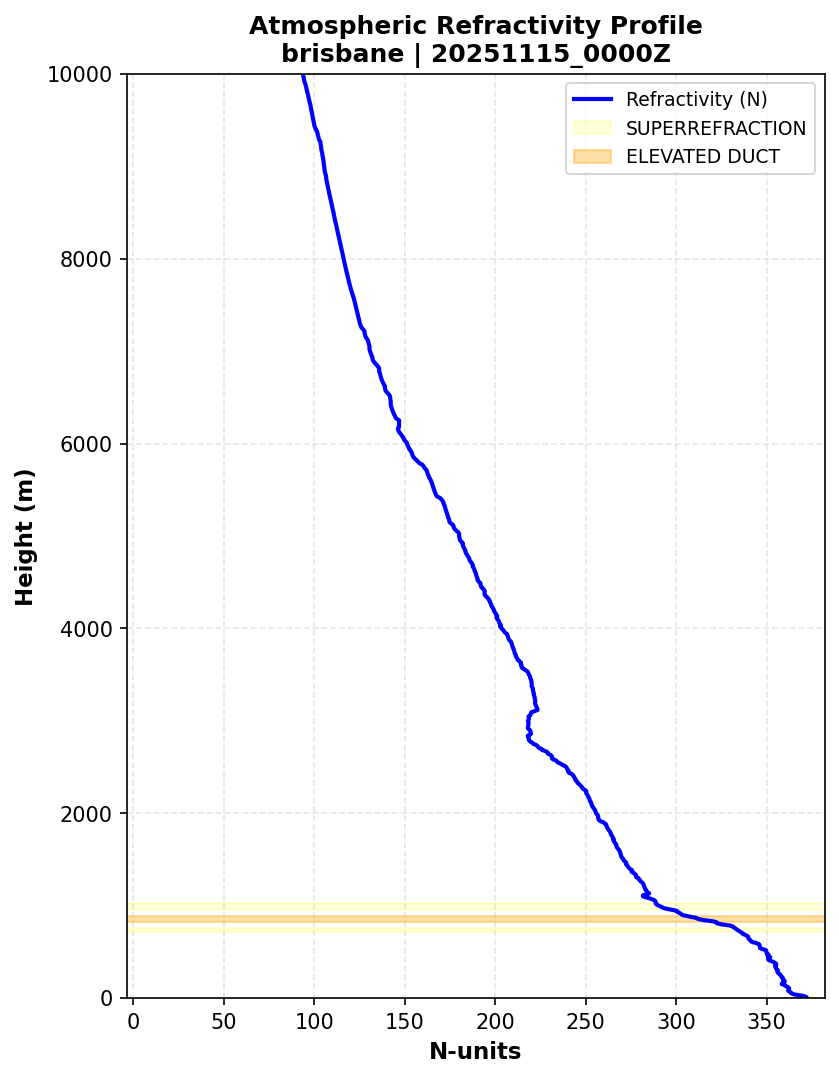
About N-Profiles: These plots show atmospheric refractivity (N-units) vs height. Ducting layers (red/orange) indicate exceptional VHF/UHF radio propagation conditions for HAM operators. Superrefraction zones (yellow) show enhanced but normal propagation.
brisbane_20251114_0000Z.png
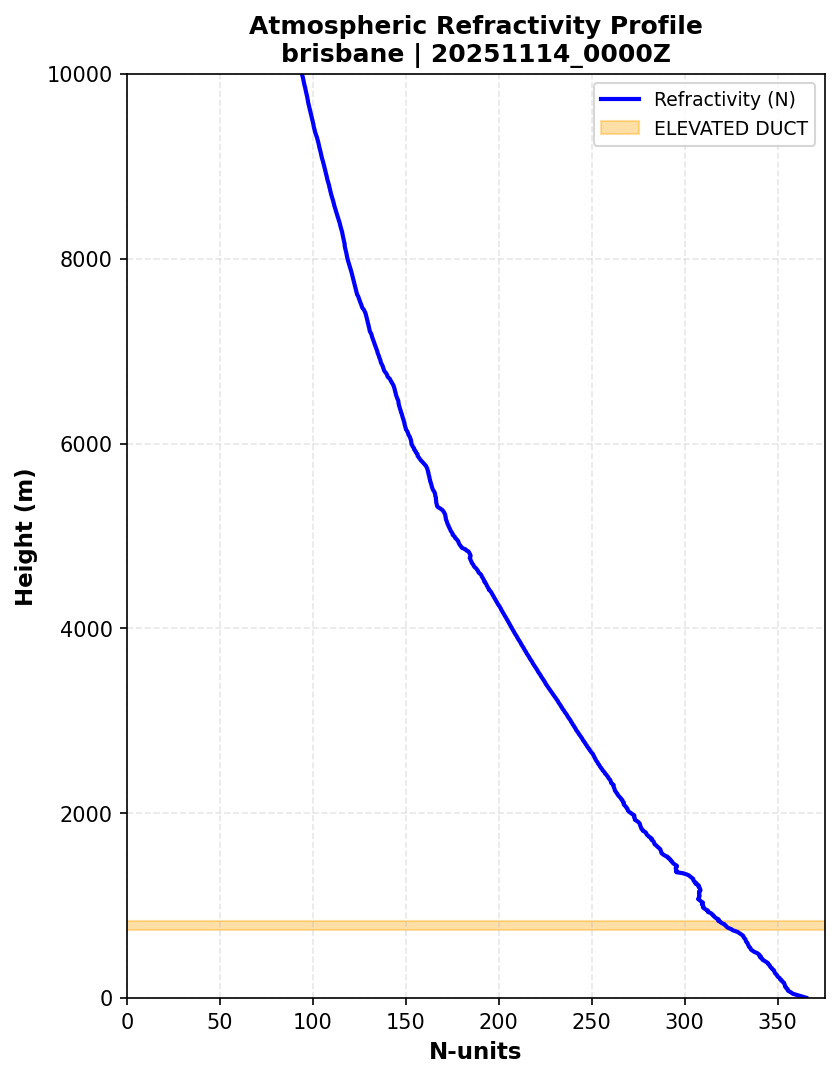
About N-Profiles: These plots show atmospheric refractivity (N-units) vs height. Ducting layers (red/orange) indicate exceptional VHF/UHF radio propagation conditions for HAM operators. Superrefraction zones (yellow) show enhanced but normal propagation.
brisbane_20251113_1200Z.png
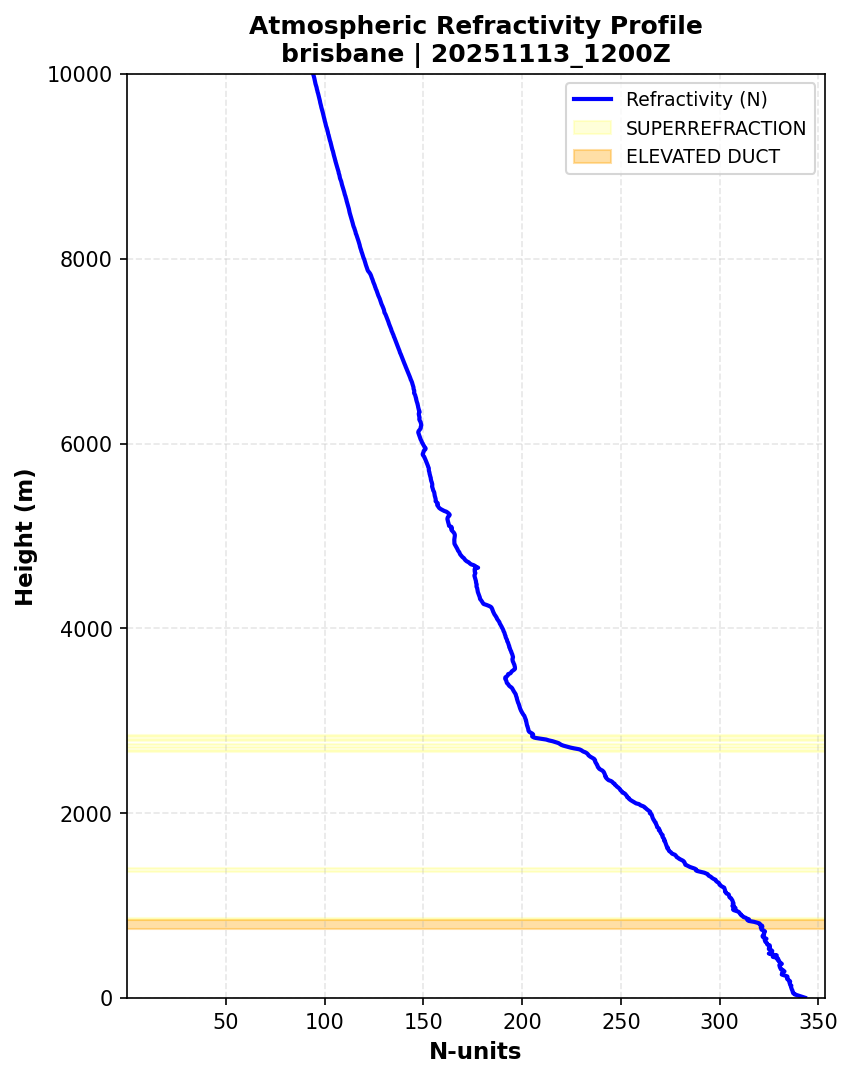
About N-Profiles: These plots show atmospheric refractivity (N-units) vs height. Ducting layers (red/orange) indicate exceptional VHF/UHF radio propagation conditions for HAM operators. Superrefraction zones (yellow) show enhanced but normal propagation.